本文基本上是对 PingCAP wenbo zhang Infra Meetup No.111 的笔记,还有对bcc的一些学习整理。
BPF原理及应用这是一个很大的话题。但是再大的话题也能分割成一个个小话题。这段时间一直在折腾BPF相关的东西,却有些像盲人摸象,摸到哪里算哪。故而写一篇文章来总结一下。
Ok, 3..2..1..Let’s do it.
先从 tracing 这个场景开始讲。
1. Kernel tracing 1.0 介绍
Static tracing -> Tracepoint(event trace)
Dynamic tracing -> kprobe
kernel tracing主要分为Static tracing 和动态 Dynamic tracing
Static tracing: 相当于对程序里面自己去写一些trace log,随着代码的编译 ,编译到代码里边。
Dynamic tracing :程序在运行的过程当中。可以在不打断程序的运行,可以对它某一个指令进行追踪。
1.1 静态 tracing 看一个静态追踪的例子:
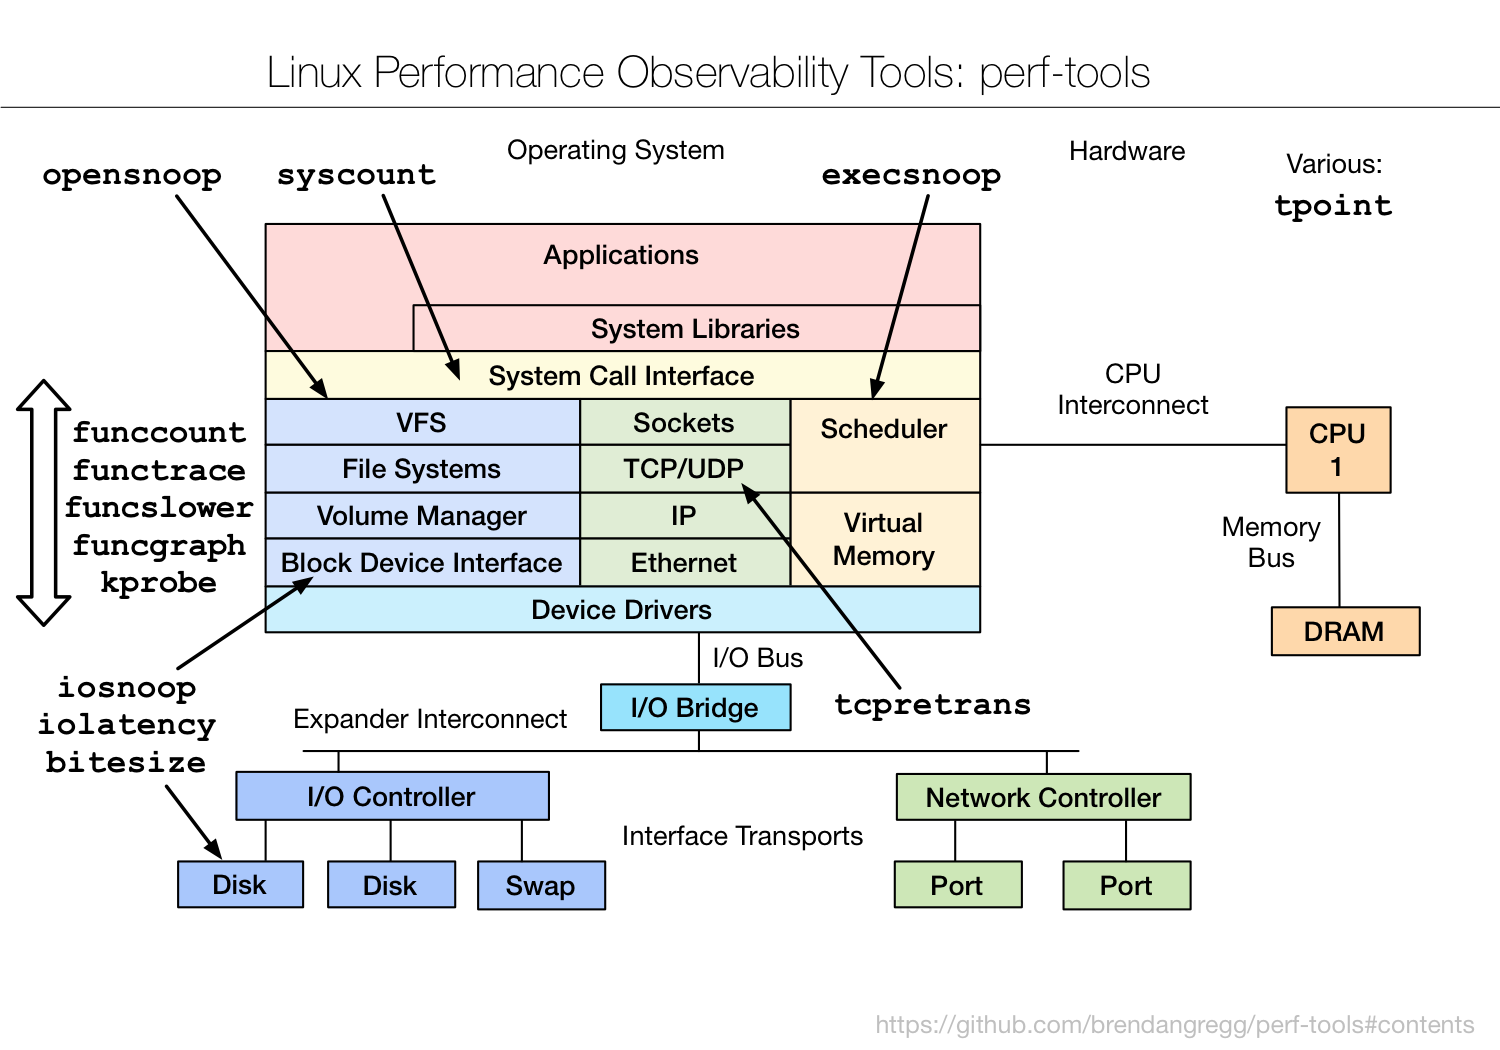
perf tools 就是基于静态 trace 实现的。
看一下perf tools中的execsnoop
execsnoop: trace process exec() with command line argument details.
execsnoop实现上是对linux调度器子系统的一些trace,以及对exec()这个系统调用的一些trace.
1
2
3
$ git clone --depth 1 https://github.com/brendangregg/perf-tools $ cd perf-tools/ $ ./execsnoop
可以得到下面的结果。
1
2
3
4
5
6
7
8
9
10
11
12
13
14
15
16
17
➜ perf-tools git:(master) ./execsnoop Tracing exec ()s. Ctrl-C to end. Instrumenting sys_execve PID PPID ARGS 3049 0 mawk -W interactive -v o=1 -v opt_name=0 -v name= [...] 3050 0 cat -v trace_pipe 3051 0 /bin/sh -c ls -l /proc/[0-9]*/fd/[0-9]* | grep socket: 3053 0 grep socket: 3052 0 ls -l /proc/1/fd/0 /proc/1/fd/1 /proc/1/fd/10 /proc/1/fd/11 /proc/1/fd/12 /proc/1/fd/13 /proc/1/fd/14 [...] 3054 0 /bin/sh -c ls -l /proc/[0-9]*/fd/[0-9]* | grep socket: 3056 0 grep socket: 3055 0 ls -l /proc/1/fd/0 /proc/1/fd/1 /proc/1/fd/10 /proc/1/fd/11 /proc/1/fd/12 /proc/1/fd/13 /proc/1/fd/14 [...] 3057 0 /bin/sh -c ls -l /proc/[0-9]*/fd/[0-9]* | grep socket: 3059 0 grep socket: 3058 0 ls -l /proc/1/fd/0 /proc/1/fd/1 /proc/1/fd/10 /proc/1/fd/11 /proc/1/fd/12 /proc/1/fd/13 /proc/1/fd/14 [...] ^C Ending tracing...
execsnoop的部分代码如下。可以看到和下面的 ftrace 例子有相似之处
1 2 3 4 5 6 7 8 9 10 11 12 13 14 15 16 17 echo nop > current_tracerif ! echo $kprobe >> kprobe_events 2>/dev/null; then makeprobe stub_execve if ! echo $kprobe >> kprobe_events 2>/dev/null; then makeprobe do_execve if ! echo $kprobe >> kprobe_events 2>/dev/null; then edie "ERROR: adding a kprobe for execve. Exiting." fi fi fi if ! echo 1 > events/kprobes/$kname /enable ; then edie "ERROR: enabling kprobe for execve. Exiting." fi if ! echo 1 > events/sched /sched_process_fork/enable ; then edie "ERROR: enabling sched:sched_process_fork tracepoint. Exiting." fi
而perf-tools 具体是基于 ftrace 实现的脚本 ,顺着思路去了解 ftrace.
1.2 ftrace 1.2.1 定义 Ftrace is an internal tracer designed to help out developers and designers of systems to fifind what is going on inside the kernel.
It can be used for debugging or analyzing latencies and performance issues that take place outside of user-space.
大概就是一个 trace 工具…
原来的ftrace 只是一个funtion trace ,
现在发展为一个框架,包含plugins events这两个方式。
1.2.2 ftrace plugins 1 2 3 4 5 6 7 8 9 10 #include <fcntl.h> #include <unistd.h> int main (void ) char buf[4096 ]; sleep(30 ); int fd = open("./test.c" ,O_RDONLY); read(fd,buf,4096 ); return 0 ; }
1 2 3 4 5 6 7 8 9 #!/bin/bash debugfs=/sys/kernel/debug echo nop > $debugfs /tracing/current_tracerecho 0 > $debugfs /tracing/tracing_onecho `pidof read ` > $debugfs /tracing/set_ftrace_pidecho function_graph > $debugfs /tracing/current_tracerecho vfs_read > $debugfs /tracing/set_graph_functionecho 1 > $debugfs /tracing/tracing_on
1 2 3 4 $ gcc 1.c -o read $ ./read # 同时在另一个终端 $ ./ftrace_test.sh
然后cat /sys/kernel/debug/tracing/trace查看结果如下。
1 2 3 4 5 6 7 8 9 10 11 12 13 14 15 16 17 18 19 20 21 22 23 24 25 26 27 28 29 30 31 32 33 34 35 36 37 38 39 40 41 42 43 44 45 46 47 48 49 50 51 52 53 54 55 56 57 58 59 60 61 62 63 64 65 66 67 68 69 # tracer: function_graph # # CPU DURATION FUNCTION CALLS # | | | | | | | 0) | vfs_read() { 0) | rw_verify_area() { 0) | security_file_permission() { 0) | apparmor_file_permission() { 0) | common_file_perm() { 0) 0.327 us | aa_file_perm(); 0) 1.756 us | } 0) 2.787 us | } 0) | __fsnotify_parent() { 0) 0.327 us | dget_parent(); 0) | dput() { 0) | dput.part.26() { 0) | _cond_resched() { 0) 0.297 us | rcu_all_qs(); 0) 0.982 us | } 0) 1.724 us | } 0) 2.372 us | } 0) 3.800 us | } 0) 0.311 us | fsnotify(); 0) 8.335 us | } 0) 9.229 us | } 0) | __vfs_read() { 0) | new_sync_read() { 0) | ext4_file_read_iter() { 0) | generic_file_read_iter() { 0) | _cond_resched() { 0) 0.291 us | rcu_all_qs(); 0) 0.847 us | } 0) | pagecache_get_page() { 0) 0.593 us | find_get_entry(); 0) 1.227 us | } 0) 0.468 us | mark_page_accessed(); 0) | _cond_resched() { 0) 0.275 us | rcu_all_qs(); 0) 0.823 us | } 0) | _cond_resched() { 0) 0.235 us | rcu_all_qs(); 0) 1.009 us | } 0) | pagecache_get_page() { 0) 0.192 us | find_get_entry(); 0) 0.622 us | } 0) | touch_atime() { 0) | __atime_needs_update() { 0) | current_time() { 0) 0.300 us | current_kernel_time64(); 0) 0.184 us | timespec_trunc(); 0) 1.126 us | } 0) 1.709 us | } 0) 2.163 us | } 0) + 11.661 us | } 0) + 12.257 us | } 0) + 13.031 us | } 0) + 13.630 us | } 0) | __fsnotify_parent() { 0) 0.180 us | dget_parent(); 0) | dput() { 0) | dput.part.26() { 0) | _cond_resched() { 0) 0.178 us | rcu_all_qs(); 0) 0.529 us | } 0) 0.882 us | } 0) 1.228 us | } 0) 1.953 us | } 0) 0.182 us | fsnotify(); 0) + 29.688 us | }
这样就可以查看刚才这个C代码中vfs_read的相关调用流程。
1.2.3 ftrace events 在/sys/kernel/debug/tracing/events目录下可以看到可以trace的事件
1 2 3 4 5 6 7 8 9 10 11 12 13 14 15 16 17 18 19 ➜ events ls alarmtimer filemap mce ras thermal block fs mdio raw_syscalls thermal_power_allocator bpf fs_dax migrate rcu timer bridge ftrace mmc regmap tlb btrfs gpio module regulator udp cgroup header_event mpx rpm vmscan clk header_page msr sched vsyscall cma huge_memory napi scsi wbt compaction hyperv net signal workqueue cpuhp i2c nmi skb writeback dma_fence iommu oom smbus x86_fpu drm irq page_isolation sock xdp enable irq_matrix pagemap spi xenexceptions irq_vectors percpu swiotlb xfs ext4 jbd2 power sync_trace xhci-hcd fib kmem printk syscalls fib6 kprobes qdisc task filelock libata random tcp
events的样例 可以看PingCAP 的Drsnoop
1.2.4 Plugins and events plugins
● list in avaliable_tracers
● set via current_tracer
● only one at a time
avaliable_tracers 目前我们只关注funtion 和 funciton_graph
events
● list in avaliable_events
● set via set_event
● any number of events can be enable
1.2.5 ftrace 的限制 ● Default, all events share a global ring buffer
● trace_pipe is globally shared, so concurrent
programs will have clashing output
● Not programmable
● Predefifined
● Max fifilter expression’s size < 4096( one page)
我觉得最关键的是不可编程。这也就是BPF 存在的意义之一。
1.2.6 trace-cmd 对 ftrace 进行了一层封装的CLI工具,也称为trace 的frontend,简单好用。
1 2 3 $ sudo apt-get install -y trace-cmd $ sudo trace-cmd record -p function_graph -P 12089 -e $ sudo trace-cmd report
大家可以执行一下。
1.3 动态 tracing kprobe
1.3.1Definition Kprobe enables you to dynamically break into any kernel routine and collect debugging and performance information non-disruptively. You can trap at almost any kernel code address, specifying a handler routine to be invoked when the breakpoint is hit.
kprobe 几乎可以对内核中每一条指令进行打断。实际上是做的一个指令(代码)替换,执行到某一条被替换的指令会触发异常。内核会判断是gdb引发的异常还是kprobe引发的异常。如果是kprobe引发的异常,会把正常的指令替换回来,然后去调用已注册的回调函数。
有些和kprobe相关的函数不能trace, 定义在/sys/kernel/debug/kprobes/blacklist
1.3.2 kprobe jprobe uprobe ● A kprobe can be inserted on virtually any instruction in the kernel.
● A jprobe is inserted at the entry to a kernel function, and provides convenient access to the function’s arguments.
● A return probe fifires when a specifified function returns.
rprobe 和jprobe 是基于kprobe的封装,简化了一些工作。
jprobe 只能放在函数的开始
rprobe 只能放在函数的返回阶段
但是我目前在bcc 中是直接使用kprobe 和kretprobe .估计做了一层封装
1.3.3 biosnoop 1 2 3 4 5 void blk_account_io_start (struct request *rq, bool new_io) void blk_start_request (struct request *req) void blk_mq_start_request (struct request *rq) void blk_account_io_done (struct request *req)
前三个函数是IO开始
blktrace
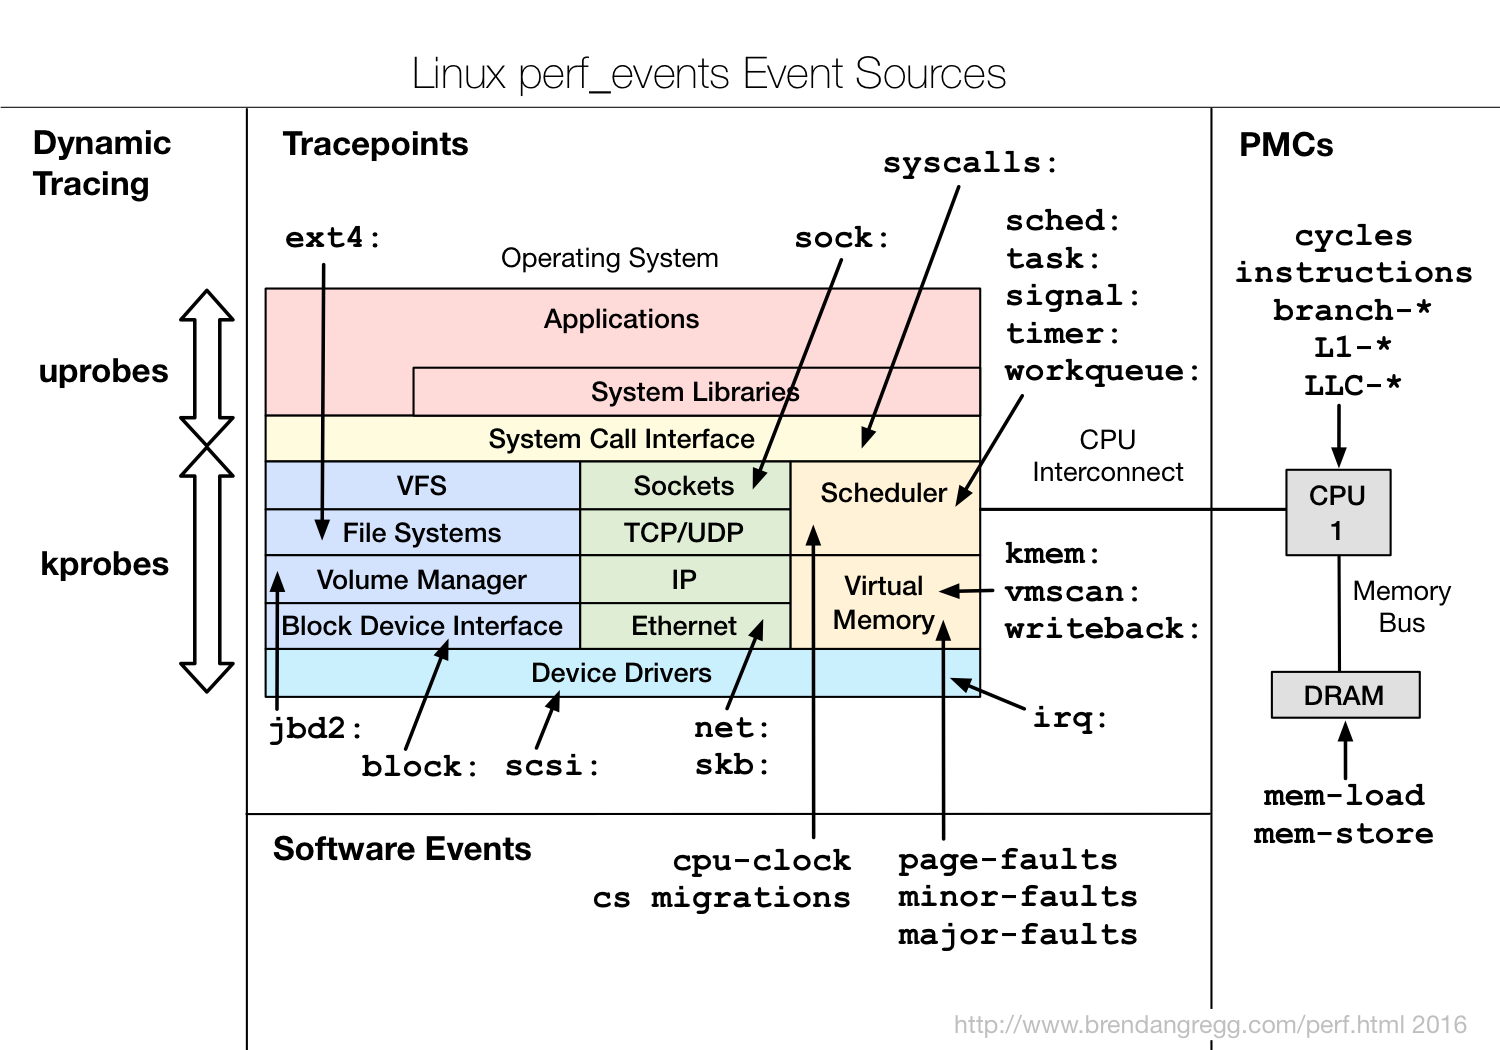
perf_events
front-end
perf
所以一个问题。已经有了这些这么好的工具。为什么还需要BPF?
BPF整合了kprobe 和 tracepoint 从我的视角来说。或者说一个上层的使用者来说。
BPF characteristic
● User-defifined callback functions and data processing can run directly in kernel space
● The user’s callback function impl is dyn executed, doesn’t participate in the compilation of the kernel, just like scripts
● Provide a unifified tracing framework for users
● BPF programs never crash kernel
● In addition, can do high-performance network processing or sandbox
1.解决了数据拷贝问题。
2.用户态的回调函数是动态执行的,不需要参与内核的编译。
3.提高了一个统一的框架,可以用kprobe,可以用ftrace 。通过调用不同的helper函数就可以和不同的子系统打交道。
4.不会导致内核挂掉。
BPF tools
对比 perf_tools 和perf_events 丰富了很多。
3.1 BPF 优势 ● Making the kernel programmable without having to cross kernel/user space boundaries
● Given the flflexibility of a programmable data path
● BPF programs can be updated without restart kernel
● BPF provides a stable API to user space
● Kernel guarantees safety, BPF programs never crash kernel
3.2 BPF 指令集 ● Eleven 64 bit registers (r0~r10) with 32 bit sub registers (zero-exntend)
○ r10 (ro, fp)
○ r0 (ret val)
○ r1 - r5 (args to helper func)
○ r1 (ctx defifined by prog_type)
○ r6 - r9 (callee saved regs on helper func call)
● One PC register
● 512B BPF stack space
Map one to one to HW CPU
regs, when jit enabled
Limit
● BPF_CALL0 ~ BPF_CALL5
● Max 4096 insts per prog
● Verififier fobids loops (kernel 5.3 will
support bounded loops)
● Max 32 tail calls
依旧是不太了解,但只是一个概念。
3.3 BPF Help Functions 3.3.1 定义 Helper functions are a concept which enables BPF programs to consult a core kernel defifined set of function calls in order to retrieve / push data from /to the kernel. Available helper functions may differ for each BPF program type.
不同的BPF程序类型可用的helper functions 不同。
3.3.2 样例
bpf_probe_read()
bpf_ktime_get_ns()
bpf_get_current_pid_tgid()
bpf_get_current_uid_gid()
bpf_get_current_comm()
bpf_get_current_task()
bpf_log2l()
bpf_get_prandom_u32()
bpf_trace_printk()
perf_submit()
有啥用呢 具体看bcc程序。
3.4 bpf_program_type 目前我关注的是BPF_PROG_TYPE_KPROBE
BPF_PROG_TYPE_TRACEPOINT
其他暂且不管。
https://elixir.bootlin.com/linux/latest/source/include/uapi/linux/bpf.h#L171
1 2 3 4 5 6 7 8 9 10 11 12 13 14 15 16 17 18 19 20 21 22 23 24 25 26 27 28 29 30 31 32 33 enum bpf_prog_type { BPF_PROG_TYPE_UNSPEC, BPF_PROG_TYPE_SOCKET_FILTER, BPF_PROG_TYPE_KPROBE, BPF_PROG_TYPE_SCHED_CLS, BPF_PROG_TYPE_SCHED_ACT, BPF_PROG_TYPE_TRACEPOINT, BPF_PROG_TYPE_XDP, BPF_PROG_TYPE_PERF_EVENT, BPF_PROG_TYPE_CGROUP_SKB, BPF_PROG_TYPE_CGROUP_SOCK, BPF_PROG_TYPE_LWT_IN, BPF_PROG_TYPE_LWT_OUT, BPF_PROG_TYPE_LWT_XMIT, BPF_PROG_TYPE_SOCK_OPS, BPF_PROG_TYPE_SK_SKB, BPF_PROG_TYPE_CGROUP_DEVICE, BPF_PROG_TYPE_SK_MSG, BPF_PROG_TYPE_RAW_TRACEPOINT, BPF_PROG_TYPE_CGROUP_SOCK_ADDR, BPF_PROG_TYPE_LWT_SEG6LOCAL, BPF_PROG_TYPE_LIRC_MODE2, BPF_PROG_TYPE_SK_REUSEPORT, BPF_PROG_TYPE_FLOW_DISSECTOR, BPF_PROG_TYPE_CGROUP_SYSCTL, BPF_PROG_TYPE_RAW_TRACEPOINT_WRITABLE, BPF_PROG_TYPE_CGROUP_SOCKOPT, BPF_PROG_TYPE_TRACING, BPF_PROG_TYPE_STRUCT_OPS, BPF_PROG_TYPE_EXT, BPF_PROG_TYPE_LSM, BPF_PROG_TYPE_SK_LOOKUP, };
具体参考https://github.com/iovisor/bcc/blob/master/docs/reference_guide.md
todo:有啥用呢。具体看待会bcc程序
3.5 BPF Maps
图片上直观的认知。BPF map 打通了内核态和用户态的数据传递。
3.5.1 Maps types Current Generic Maps
● BPF_MAP_TYPE_HASH
● BPF_MAP_TYPE_ARRAY
● BPF_MAP_TYPE_PERCPU_HASH
● BPF_MAP_TYPE_PERCPU_ARRAY
● BPF_MAP_TYPE_LRU_HASH
● BPF_MAP_TYPE_LRU_PERCPU_HASH
● BPF_MAP_TYPE_LPM_TRIE
Current Non-Generic Maps
● BPF_MAP_TYPE_PROG_ARRAY
● BPF_MAP_TYPE_PERF_EVENT_ARRAY
● BPF_MAP_TYPE_CGROUP_ARRAY
● BPF_MAP_TYPE_STACK_TRACE
● BPF_MAP_TYPE_ARRAY_OF_MAPS
● BPF_MAP_TYPE_HASH_OF_MAPS
对底层key/value进行封装。
目前我只关注前两个 BPF_MAP_TYPE_HASH BPF_MAP_TYPE_ARRAY
有啥用、如何用,具体看bcc程序。
3.5.2 BPF MAP ● Kernel header
bpf/bpf_helpers.h
● User-space header
tools/lib/bpf/bpf.h
The differences
● in user-space use the fd to access the map, rather than using the pointer to the map directly.
● Bpf_map_get_next_key can only be used in user-space
用户态用文件描述fd访问map,内核态直接用指针访问map.
Bpf_map_get_next_key 只能在用户态使用
3.5.3 Loader ● bcc/bpftrace
● perf
● iproute2 (ip tc)
● ebpf_exporter
● cilium
BPF需要加载到内核。上面是一些可用的loader。
接下来。我希望用 bcc 代码把上面提到的几个点都串起来。
Helper Functions
maps
bpf_program_type
4.BCC 4.1 安装 bcc 环境 1 2 3 4 5 6 7 8 9 10 11 12 13 14 sudo apt-get update sudo apt-get -y install bison build-essential cmake flex git libedit-dev libllvm6.0 llvm-6.0-dev libclang-6.0-dev python zlib1g-dev libelf-dev libfl-dev git clone https://github.com/iovisor/bcc.git mkdir bcc/build; cd bcc/build cmake .. make sudo make install cmake -DPYTHON_CMD=python3 .. pushd src/python/make sudo make install popd
1 2 3 4 5 6 7 8 9 10 11 12 13 14 15 16 17 18 19 20 21 22 23 24 25 26 27 28 29 30 31 32 33 34 35 36 37 38 39 40 41 42 43 44 45 46 47 48 49 50 51 52 53 54 55 56 57 58 59 60 61 62 63 64 65 66 67 68 69 70 71 72 73 74 75 76 77 78 79 80 81 82 83 84 85 86 87 88 bpf_text = """ #include <uapi/linux/ptrace.h> enum stat_types { S_READ = 1, S_WRITE, S_FSYNC, S_OPEN, S_CREATE, S_MAXSTAT }; BPF_ARRAY(stats, u64, S_MAXSTAT); static void stats_increment(int key) { u64 *leaf = stats.lookup(&key); if (leaf) (*leaf)++; } """ bpf_text_kprobe = """ void do_read(struct pt_regs *ctx) { stats_increment(S_READ); } void do_write(struct pt_regs *ctx) { stats_increment(S_WRITE); } void do_fsync(struct pt_regs *ctx) { stats_increment(S_FSYNC); } void do_open(struct pt_regs *ctx) { stats_increment(S_OPEN); } void do_create(struct pt_regs *ctx) { stats_increment(S_CREATE); } """ bpf_text_kfunc = """ KFUNC_PROBE(vfs_read, int unused) { stats_increment(S_READ); return 0; } KFUNC_PROBE(vfs_write, int unused) { stats_increment(S_WRITE); return 0; } KFUNC_PROBE(vfs_fsync, int unused) { stats_increment(S_FSYNC); return 0; } KFUNC_PROBE(vfs_open, int unused) { stats_increment(S_OPEN); return 0; } KFUNC_PROBE(vfs_create, int unused) { stats_increment(S_CREATE); return 0; } """ is_support_kfunc = BPF.support_kfunc() if is_support_kfunc: bpf_text += bpf_text_kfunc else : bpf_text += bpf_text_kprobe b = BPF(text=bpf_text) if not is_support_kfunc: b.attach_kprobe(event="vfs_read" , fn_name="do_read" ) b.attach_kprobe(event="vfs_write" , fn_name="do_write" ) b.attach_kprobe(event="vfs_fsync" , fn_name="do_fsync" ) b.attach_kprobe(event="vfs_open" , fn_name="do_open" ) b.attach_kprobe(event="vfs_create" , fn_name="do_create" ) stat_types = { "READ" : 1 , "WRITE" : 2 , "FSYNC" : 3 , "OPEN" : 4 , "CREATE" : 5 } print ("%-8s " % "TIME" , end="" )for stype in stat_types.keys(): print (" %8s" % (stype + "/s" ), end="" ) idx = stat_types[stype] print ("" )i = 0 while (1 ): if count > 0 : i += 1 if i > count: exit() try : sleep(interval) except KeyboardInterrupt: pass exit() print ("%-8s: " % strftime("%H:%M:%S" ), end="" ) for stype in stat_types.keys(): idx = stat_types[stype] try : val = b["stats" ][c_int(idx)].value / interval print (" %8d" % val, end="" ) except : print (" %8d" % 0 , end="" ) b["stats" ].clear() print ("" )
最重要的代码解读 明天写
1 2 3 4 5 6 7 8 9 10 11 12 13 14 15 16 17 18 19 20 21 22 23 24 25 26 27 28 29 30 31 32 33 34 35 36 37 38 39 40 41 42 43 44 45 46 47 48 49 50 51 52 53 54 55 56 57 58 59 60 61 62 63 64 65 66 67 68 69 70 71 72 73 74 75 76 77 78 79 80 81 82 83 84 85 86 87 88 89 90 91 92 93 94 95 96 97 98 99 100 101 102 103 #include <uapi/linux/ptrace.h> #include <linux/blkdev.h> struct start_req_t { u64 ts; u64 data_len; }; struct val_t { u64 ts; u32 pid; char name[TASK_COMM_LEN]; }; struct data_t { u32 pid; u64 rwflag; u64 delta; u64 qdelta; u64 sector; u64 len; u64 ts; char disk_name[DISK_NAME_LEN]; char name[TASK_COMM_LEN]; }; BPF_HASH(start, struct request *, struct start_req_t ); BPF_HASH(infobyreq, struct request *, struct val_t ); BPF_PERF_OUTPUT(events); int trace_pid_start (struct pt_regs *ctx, struct request *req) struct val_t val = u64 ts; if (bpf_get_current_comm(&val.name, sizeof (val.name)) == 0 ) { val.pid = bpf_get_current_pid_tgid() >> 32 ; if (##QUEUE##) { val.ts = bpf_ktime_get_ns(); } infobyreq.update(&req, &val); } return 0 ; } int trace_req_start (struct pt_regs *ctx, struct request *req) struct start_req_t start_req = .ts = bpf_ktime_get_ns(), .data_len = req->__data_len }; start.update(&req, &start_req); return 0 ; } int trace_req_completion (struct pt_regs *ctx, struct request *req) struct start_req_t *startp ; struct val_t *valp ; struct data_t data = u64 ts; startp = start.lookup(&req); if (startp == 0 ) { return 0 ; } ts = bpf_ktime_get_ns(); data.delta = ts - startp->ts; data.ts = ts / 1000 ; data.qdelta = 0 ; valp = infobyreq.lookup(&req); data.len = startp->data_len; if (valp == 0 ) { data.name[0 ] = '?' ; data.name[1 ] = 0 ; } else { if (##QUEUE##) { data.qdelta = startp->ts - valp->ts; } data.pid = valp->pid; data.sector = req->__sector; bpf_probe_read_kernel(&data.name, sizeof (data.name), valp->name); struct gendisk *rq_disk = bpf_probe_read_kernel(&data.disk_name, sizeof (data.disk_name), rq_disk->disk_name); } #ifdef REQ_WRITE data.rwflag = !!(req->cmd_flags & REQ_WRITE); #elif defined(REQ_OP_SHIFT) data.rwflag = !!((req->cmd_flags >> REQ_OP_SHIFT) == REQ_OP_WRITE); #else data.rwflag = !!((req->cmd_flags & REQ_OP_MASK) == REQ_OP_WRITE); #endif events.perf_submit(ctx, &data, sizeof (data)); start.delete (&req); infobyreq.delete (&req); return 0 ; }
最重要的代码解读明天写
4.4 如果没有bcc呢? 参考一位师兄的博客。
Ubuntu下bpf纯c程序的编写与运行